

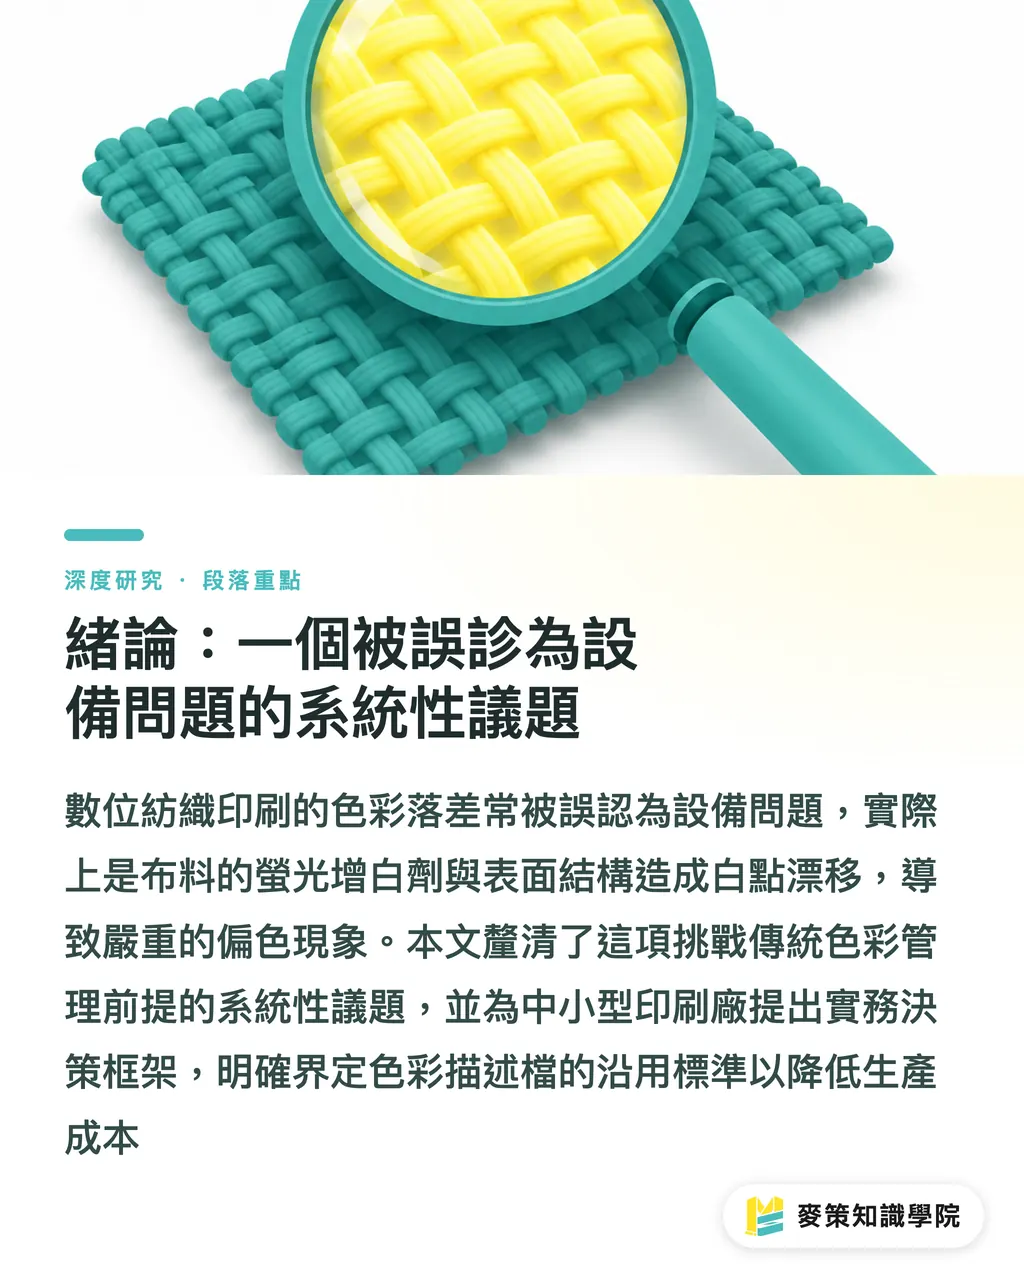
Introduction: A Systemic Issue Misdiagnosed as Machine Instability
On the print shop floor, color variation in digital textile printing has long been blamed on machine instability or operator touch. The root cause, however, lies in measurement baselines and profiling workflows. Unlike paper, fabric is an active variable in the color equation rather than a passive backdrop. Bleaching levels, optical brightening treatments, and surface texture differences all cause large shifts in the white point (the chromaticity baseline of unprinted substrate). As a result, applying the same ICC profile across different fabrics leads to noticeable color casts [1]
This issue carries academic and industrial significance across three levels:
・First, color management theory rests on the assumption that substrate white points can be measured stably. Fabric systematically violates this premise, creating an edge case for the current ICC framework
・Second, digital textile and wide-format printing have expanded recently, driving up demand for wider gamuts. CMYK plus profiles (such as CMYK plus RGB, or CMYK plus orange, green, violet) push color gamuts from around 400,000 colors in standard coated offset FOGRA 51 to over 600,000 colors [1]. A wider gamut means errors become far more visible. A narrow gamut can no longer hide white point errors
・Third, practical knowledge on this topic has long remained scattered on production floors as engineer lore, lacking structured documentation that can be searched or cited. As a global industry platform for screen and digital print, FESPA serves as a key gathering point for this hands-on technical knowledge through its technical reviews and expos [2]
The gap in existing discussions is clear. Most publications treat white point measurement, OBA interference, and measurement aperture as isolated technical topics. Very few connect all three into a single causal chain or address the practical question: when should you rebuild a profile, and when can you keep using an existing one? This article makes three contributions, each mapping to a main section:
・First, it breaks white point drift down into three causes: physical substrate traits, chemical brighteners, and measurement mechanics, explaining why all three strike at once on fabric but can usually be handled separately on paper (Sections 3 and 4)
・Second, it evaluates current technical solutions (standard backings, large-aperture spectrophotometers, M-standard selection, and iccMAX spectral workflows), showing which root cause each addresses and what residual errors remain (Section 5)
・Third, it offers a practical workflow framework for small and medium print shops, defining clear criteria for when a profile remains usable to avoid the excessive cost of rebuilding profiles for every batch (Sections 6 and 7)
Literature and Current State: Three Disconnected Threads and Their Intersection
This section organizes existing discussions into three groups, outlining how each connects to our analysis
Group one focuses on physical substrate properties. This line of research points out that most fabrics are translucent. Measuring a white fabric patch on a dark tabletop lets the background bleed through, pulling the white point darker and cooler. Without standard backings like calibrated white ceramic plates or black traps, an ICC profile will be built on contaminated data [1]. This line also shows that woven, knitted, or yarn textures create microscopic shadow pockets across the fabric surface. Standard spectrophotometers with small 2 to 4 mm apertures capture these shadows, artificially depressing lightness L* values and leading profiling software to assume the white point is darker than human eyes perceive [1]. These findings establish that measurement errors precede color errors. This article builds on that stance, arguing further that these errors follow a predictable systematic direction (darker and cooler). They can therefore be anticipated and caught within the workflow, rather than patched after the fact
Group two centers on chemical treatments and spectral behavior. To make fabrics look whiter than white, manufacturers apply optical brightening agents (OBAs, also called FWAs). These compounds absorb invisible ultraviolet light and re-emit it in the visible blue spectrum [1]. As a result, instrument readings diverge from what the human eye sees, with the discrepancy dictated by the spectrophotometer's measurement mode (M-standards) [1]. In addition, cotton white points shift across pre-treatment and bleaching runs, fueling the debate over whether every batch requires reprofiling [1]. Synthetic fibers like polyester turn naturally warm and yellowish after heat curing. Because dye sublimation uses transparent inks, ink hue shifts directly with the warm substrate, turning blue inks noticeably greenish on warm white fabric [1]. This group highlights that white point drift is not just a lightness issue, but a hue and spectral problem. On this basis, we argue that managing white points through a single L* or ΔE threshold will overlook hue-shift risks with transparent inks
Group three addresses workflows and process control. Rather than looking solely at measurement, this group examines how measurement results drive production decisions. Current industry advice suggests that when white point shifts appear within or between batches of the same fabric, shops should first check profile accuracy using process control software such as Bodoni PressSign, GMG, or MellowColour. If printed colors still match the ICC workflow, the profile remains usable even if the white point drifts slightly out of spec [1]. Advanced technical routes include adopting large-aperture spectrophotometers and moving toward iccMAX spectral workflows [1]. This group comes closest to our core inquiry, yet it mostly presents a menu of options. Our contribution is turning 'measure first, evaluate next, rebuild only when needed' into a sequenced decision process with explicit criteria, filling the cost control gap left by the first two groups
In summary, existing literature explains why white point drift happens, yet it leaves the most practical question unanswered: exactly how much drift requires intervention? The following sections break down that standard step by step
Why the White Point Is a Moving Target: Unpacking Three Underlying Causes
The core argument here is straightforward. Fabric white point instability stems from three independent mechanisms that act at the same time during a single measurement
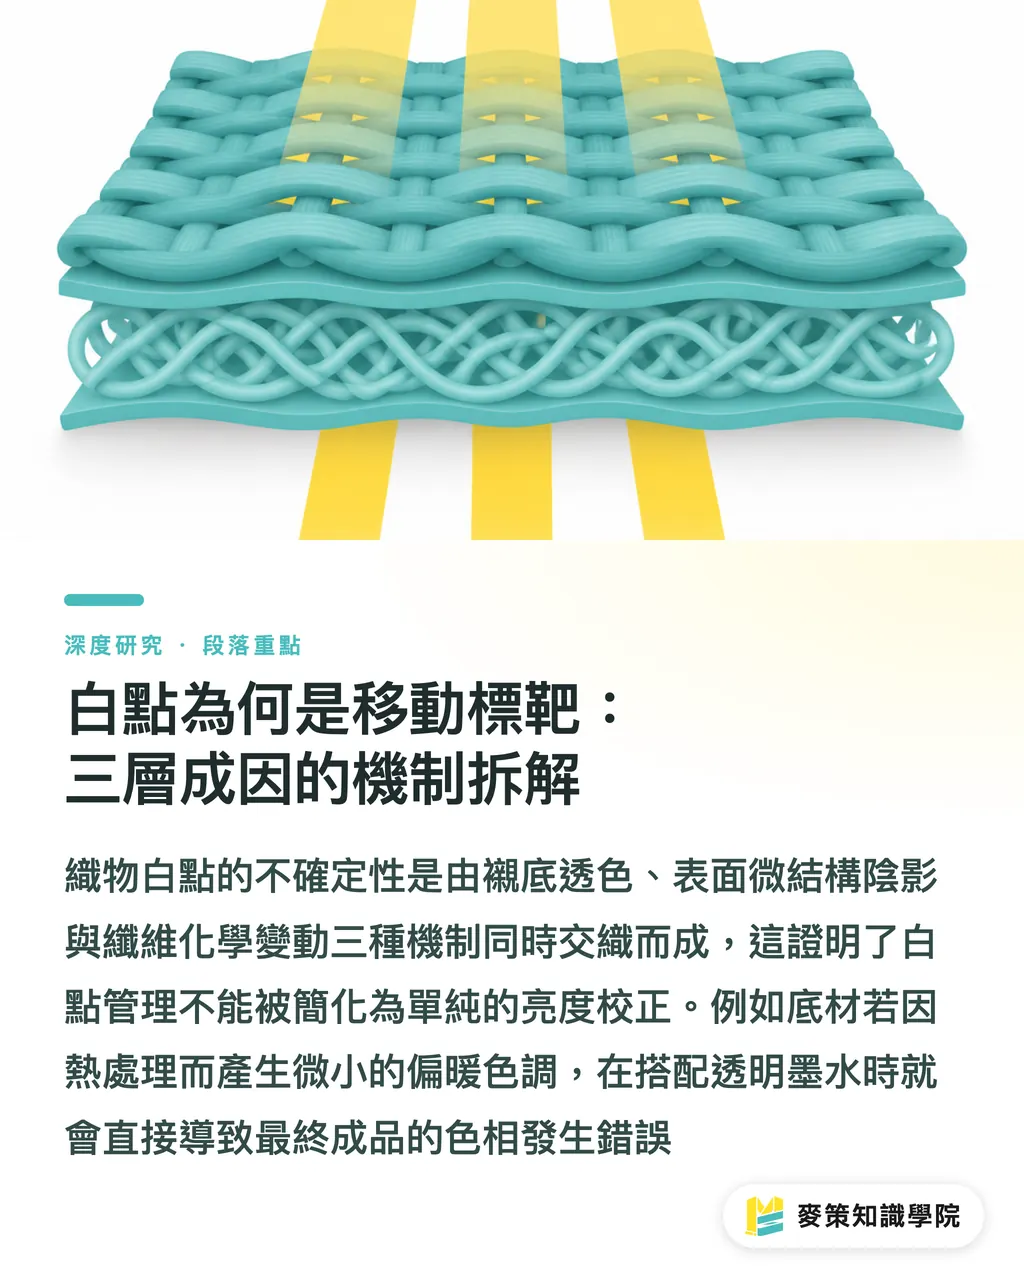
The first layer is translucency and backing bias. Most fabrics are semi-transparent, meaning readings reflect a blend of the fabric and the backing beneath it [1]. The key point is that this is not random noise. It is a directional bias. Dark backings consistently pull readings darker and cooler. Leaving backings uncontrolled creates systematic errors you could have seen coming. A single bad reading is manageable, but if an entire profile is pulled off course, visual spot-checks down the line will rarely catch the underlying flaw
The second layer is shadow cast by surface microstructure. Standard spectrophotometers have measurement apertures around 2 to 4 mm. At that scale, textured weave crevices get integrated into the reading, pulling down the L* value [1]. A 2 to 4 mm aperture does not lack precision, it simply does not match the scale of fabric. Smooth paper has low surface roughness, yielding consistent readings. Fabric weave repeats, by contrast, sit close to the aperture size. Measuring becomes an accidental sample of just a few yarn peaks and valleys, ruining repeatability. Expanding the aperture takes in far more weave cycles, eliminating reading variations across different spots on the same fabric
The third layer is batch-to-batch fiber chemistry shifts. Cotton white points fluctuate with variations in pre-treatment and bleaching, making batch-by-batch reprofiling genuinely necessary under certain conditions [1]. Polyester yellows during heat processing, transferring that shift into noticeable hue drift when using transparent sublimation inks. The classic symptom is blue shifting green [1]. White point errors quickly spiral from simple background variation into outright hue failure. Managing white points cannot focus on lightness alone. A substrate that is 0.5 units warmer might go unnoticed with opaque inks, but with transparent inks, it will throw the final color completely off
OBAs and Measurement Modes: The Gap Between Instruments and the Human Eye
The central premise here is that OBAs turn an accurate measurement into a matter of deliberate choice rather than a single objective truth
OBAs function by absorbing ultraviolet radiation and re-emitting it across visible blue wavelengths, making fabric appear brighter and whiter under UV-rich light [1]. The direct fallout of this fluorescence is that measurement results depend entirely on the UV content in the instrument light source, known as the spectrophotometer's measurement mode (M-standards) [1]. In other words, the same fabric yields different, yet technically valid, white point values across different modes, each simulating a different viewing light condition
We must define the boundary of this conclusion honestly. Our primary reference explicitly notes this dependency between measurement modes and OBAs [1], but it does not supply quantitative deviation datasets across textile substrates. Therefore, we make no claims regarding exact numerical spreads between specific modes. What remains certain is procedural. The measurement mode must be locked in before building profiles and aligned with the viewing light used during client approval. If the proofing room and the client view under different conditions, color disputes are baked into the workflow before printing even starts
The practical takeaway runs deeper. OBA concentration shifts across batches and supply chains. When a mill changes hands or finishing formulas get tweaked, fluorescent behavior shifts even if the product SKU stays identical. That makes fabric spec sheets unreliable for color management. Actual measurement records are the only dependable baseline, which is why we advocate building an in-house fabric white point database
Effectiveness and Residual Errors: From Large Apertures to iccMAX
The main point here is that three current solutions target different root causes, meaning they must work together rather than as either-or choices
・Solution 1, standard backings. Measuring over calibrated white ceramic tiles or black traps [1] eliminates translucency bias at layer one. The residual error is that while backings standardize measurements, they may not match real-world conditions. A single-layer hanging banner, for instance, is viewed in an environment very different from a white-backed measurement plate
・Solution 2, large-aperture spectrophotometers. Expanding the measurement aperture increases spatial averaging across the fabric, curbing the shadow suppression on L* [1]. The residual drawback is that larger apertures demand larger, uniform patches. That inflates test chart dimensions and fabric waste, squeezing margins on short-run custom jobs
・Solution 3, iccMAX spectral workflows. Using spectral data rather than single colorimetric values to describe material behavior represents a more advanced path [1]. The residual challenge lies in adoption hurdles. Spectral workflows require compatible RIP engines, software, and skilled operators, demanding far higher upfront capital and training investments than the first two options
Beyond these three, a white ink underbase introduces its own variable. On dark or colored textiles, white ink replaces the fabric as the functional white point. The profiling challenge shifts to opacity and ink laydown uniformity [1]. A white underbase turns an uncontrollable substrate white point into a controllable process white point, acting as an effective way to rein in variation. Still, it adds another variable to maintain on press
Gamut expansion demands attention as well. CMYK plus profiles push gamuts from roughly 400,000 colors under FOGRA 51 to over 600,000 colors [1]. Expanding the gamut by over 50% means colors that previously fell out of gamut and got clipped to the perimeter, looking uniformly flat, can now be printed. That also means they will be closely scrutinized. Pushing for wider gamuts without strict white point discipline backfires. Better machine capability simply magnifies existing measurement flaws
Decision Framework: Four Steps From White Point Measurement to Prepress Verification
This section lays out an actionable framework designed to strike a balance between color precision and profiling costs. We call this the textile extension of Mai Strategy's Three Prepress Checkpoints. It spans four sequential steps mapped directly from the reference material [1]
Step one, fabric white point measurement. For every incoming fabric roll, take multiple readings over a standard backing using a fixed measurement mode and aperture. Log both the average and spread. Spectrophotometers like the i1Pro 3 can build repeatable baselines across diverse substrates [1]. The output here is never a single data point, but a dataset capturing natural variation
Step two, condition profiling and grouping. Group fabrics by white point coordinates and OBA behavior, letting fabrics in the same cluster share a profile. The decision rule here matters most: if process control software confirms that printed colors still adhere to the ICC workflow, keep running the current profile even if the white point drifts slightly out of spec [1]. This shifts the focus from 'did the white point change' to 'did printed colors fail,' preventing print shops from overreacting and rebuilding profiles with every incoming batch
Step three, material-specific profiling. Generate new profiles only for fabrics that fall outside existing clusters. Prioritize textiles with erratic pre-treatment swings, like cotton, or dark fabrics running a white underbase [1]
Step four, prepress proof verification. Output proofs using the exact fabric, white ink density, and post-finishing conditions planned for production. Approve colors under the agreed viewing light. This step confirms not just the final shade, but that the assumptions made in steps one through three hold up under real pressroom conditions

Implications for the Design and Print Industry in Taiwan
This section outlines actionable steps across three levels: small and medium print shops, designers, and brand owners
For small and medium print shops and wide-format service providers. In Taiwan, these businesses compete on short runs, high variety, and fast turnarounds. They cannot afford the downtime of rebuilding profiles for every batch. The practical move is investing in measurement discipline rather than piling up profiles. Set clear standards for backing plates and fixed measurement modes. Build an in-house fabric white point database so incoming stock is checked against existing clusters first. Only generate a new profile when a fabric fails the cluster check. Measuring and comparing takes tens of minutes, whereas rebuilding a profile from scratch requires target printing, curing, and reading, eating up hours. Moving the decision point upstream to measurement provides the cleanest way to cut costs. Shops also need to abandon the habit of blaming color fights on machine instability. The real culprit is profiling baselines that never matched the fabric in the first place [1]
For designers. Designers must recognize that the white point is a variable living outside the design file. When artwork features broad pale tints, demands neutral grays, or runs on transparent inks, a warm substrate shifts hues immediately. Blue turns greenish on warm white fabric [1]. Lock in fabrics during initial pitches. Stop relying on paper proofs to approve textile print colors. Define acceptable tolerances for core brand colors instead of handing down an isolated Pantone number
For brand owners. The costliest losses for brands stem from vague sign-off standards. Three actions solve this. First, mandate advance notice in procurement contracts whenever fabric vendors or production lots change. Second, specify the exact viewing light and measurement mode for approvals. Third, accept the physical reality that brand colors require defined tolerances across different substrates, rather than demanding impossible cross-substrate uniformity. That third shift is the hardest to accept, but it yields the greatest payoff. It turns endless subjective arguments into straightforward evaluations based on clear specs
Conclusion and Limitations
This article addresses the research problem posed at the start: textile ICC profiles fail because fabric white points drift across physical translucency, surface microstructure, and chemical brightening simultaneously, invalidating the baseline [1]. Countermeasures must address each layer directly. Standard backings resolve translucency bias, large-aperture spectrophotometers counter weave shadows, measurement mode selection and iccMAX workflows manage fluorescence, and white ink underbases turn substrate wildcards into controlled process variables [1]. Operationally, shops should evaluate whether printed colors still match the ICC workflow rather than asking if the white point moved, striking a sustainable balance between precision and overhead [1]
Two limitations must be stated clearly:
・First, limited source data coverage. Our technical assertions draw primarily from a single trade review published by FESPA on August 11, 2026 [1]. That piece is an industry review rather than a controlled lab study, presenting findings on measurement modes, aperture effects, and gamut counts without publishing raw datasets. We therefore cannot quantify or rank the precise performance gains of each remedy, only outline the layer each addresses
・Second, boundaries of generalization. These mechanisms and workflow recommendations apply to digital textile printing, soft signage, and wide-format sublimation. Specific details, like cotton pre-treatment swings and polyester yellowing during heat fixation, reflect fiber-specific traits [1]. They should not be applied directly to coated paper, non-woven synthetics, or traditional screen printing. Similarly, comparing roughly 400,000 colors in FOGRA 51 against over 600,000 in CMYK plus represents a benchmark under defined test setups [1], not a guarantee for any single piece of hardware
Three practical research paths follow, each with clear data requirements and methodologies:
・First, track pre-treatment parameters and white point coordinates across consecutive production batches of the same cotton fabric, running regression models between batch variations and color difference to quantify exactly how much white point drift triggers a profile rebuild
・Second, conduct repeated measurements across a single fabric lot using different apertures and measurement modes to isolate how much aperture size and fluorescence contribute to L* and b* readings, testing whether these three root causes can truly be separated
・Third, compare batch-to-batch color consistency between white ink underbase workflows and direct-to-fabric workflows, evaluating how well white ink functions as a buffer against fabric variability. Continued progress across the industry can be tracked through FESPA expos and technical presentations [2]
Further reading: FESPA Feature: What Are the Issues With Textiles and Varying White Points and ICC Profiling?
Key Takeaways
Textile ICC profile inaccuracies do not stem from unstable machinery, but from fabric white points shifting across translucency, weave shadows, and optical brighteners at the same time, wrecking the measurement baseline
The 2 to 4 mm aperture on standard spectrophotometers sits on roughly the same scale as fabric weave textures. It pulls weave shadows into the reading and artificially suppresses L* values. Expanding the aperture directly resolves this
Optical brightening agents (OBAs) absorb ultraviolet light and re-emit it as visible blue light, making readings dependent on the spectrophotometer's measurement mode (M-standards). Proofing and final approval must use the exact same mode
The rule for rebuilding profiles is whether printed colors still conform to the ICC workflow, not whether the white point shifted. When the white point drifts slightly out of spec but printed colors hold true, keep running the current profile
CMYK plus pushes color gamuts from roughly 400,000 colors in FOGRA 51 past 600,000 colors. That wider gamut also makes existing white point errors far more noticeable, requiring tighter process control
Further Considerations
Print shops should redirect money away from endless reprofiling and invest in solid measurement discipline. Setting up standard backings, locking down measurement modes, and maintaining a fabric database costs far less, using hard numbers to cut through subjective finger-pointing. Designers must specify exact fabrics during the pitch phase, because paper proofs will never show how transparent inks skew on warm textile bases. For AI adoption, the smart bet is automated white point clustering and anomaly detection, predicting whether reprofiling is truly necessary based on historical data rather than personal hunches. Software vendors have an opening to build lightweight tools that connect instrument readings, press checks, and approval specs, helping smaller shops trace production lots without friction. Three unresolved questions remain. First, no open datasets quantify how much each underlying cause contributes to total drift. Second, we lack cross-material benchmarks for how measurement modes skew on varied textile substrates. Third, the true effectiveness of white ink underbases as a buffer layer has yet to be verified systematically
References
[2] Worldwide S. (2026). FESPA 2026: Everything You Need to Know About the Global Print Expo. DOI: 10.55277/researchhub.auzfba6r
[3] Emmott E., Jay M., Woodman J. (2018). Cohort Profile: Children in Need Census (CIN) records of children referred for social care support in England (Pre-Print). DOI: 10.31219/osf.io/z5rqc
[4] Steele G., White J. (2004). How to print floating-point numbers accurately. ACM SIGPLAN Notices. DOI: 10.1145/989393.989431
[5] Steele G., White J. (1990). How to print floating-point numbers accurately. ACM SIGPLAN Notices. DOI: 10.1145/93548.93559
FAQ
- Why does the same ICC profile cause severe color shifts across different fabrics?
- Fabric white points act as moving variables rather than fixed baselines. Fabric translucency lets background colors show through, weave texture casts shadows that pull down measured lightness, and optical brightening agents shift spectral behavior. When all three happen at once, the measurement baseline used to build the profile no longer matches the actual fabric
- Does every incoming fabric batch require a brand new ICC profile?
- Not necessarily. The proper workflow starts with checking existing profile accuracy using process control tools like Bodoni PressSign, GMG, or MellowColour. If printed output still conforms to the ICC workflow, keep running the current profile even if the white point moves slightly out of spec. Cotton involves wide swings in pre-treatment and bleaching, making it far more likely to need reprofiling than synthetic fibers
- What is the most common mistake when measuring fabric white points?
- Skipping a standard backing. Reading semi-transparent white fabric on a dark table lets the surface underneath bleed through, dragging the white point darker and cooler. This builds the entire profile on corrupted data. Always measure over a calibrated white ceramic plate or a black trap
- Why does blue print turn greenish on polyester fabric?
- Polyester naturally yellows when heat cured. Because dye sublimation uses transparent inks, the final color is driven directly by underlying substrate tone. When the white point turns warm, blue ink laid over a yellowish base drifts toward green
- Should a shop invest in a large-aperture spectrophotometer or an iccMAX workflow first?
- Start with a large-aperture spectrophotometer. It tackles measurement errors caused by weave shadows directly and comes with a much lower cost and adoption curve. While an iccMAX spectral workflow models material behavior more thoroughly, it demands compatible RIPs, software, and skilled operators, making it an advanced investment stage
Related articles





The Print × AI weekly
The print and AI know-how designers, brands and enterprises can use before they commit — one email, every week
MINDS Free Tools
Imposition calculator and preflight file check — free prepress tools, right in your browser.
MINDS Group
Need actual printing or gifting services?
From premium printing to online ordering and festive gifts — the MINDS Group sister brands take it from here.